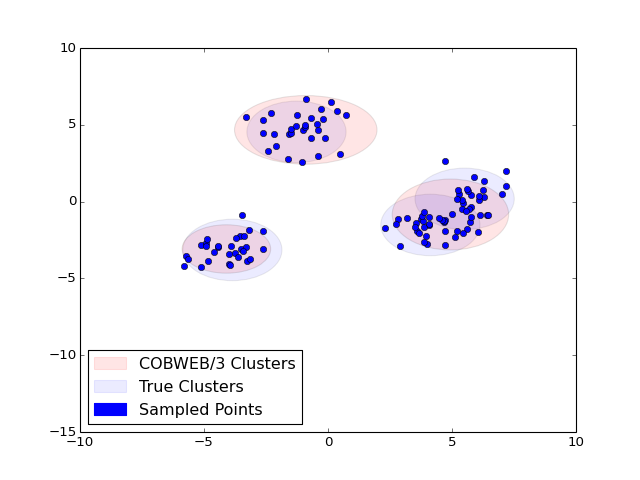
Clustering Simulated 2D Data
from __future__ import print_function
from __future__ import unicode_literals
from __future__ import absolute_import
from __future__ import division
from random import normalvariate
from random import shuffle
from random import uniform
from random import seed
#import time

import matplotlib.pyplot as plt
import matplotlib.patches as mpatches
from matplotlib.patches import Ellipse

from concept_formation.cobweb3 import Cobweb3Tree
from concept_formation.cobweb3 import cv_key as cv

seed(0)

num_clusters = 4
num_samples = 30
sigma = 1

xmean = [uniform(-8, 8) for i in range(num_clusters)]
ymean = [uniform(-8, 8) for i in range(num_clusters)]
label = ['bo', 'bo', 'bo', 'bo', 'bo', 'bo', 'bo']
shuffle(label)
label = label[0:num_clusters]

data = []
actual = []
clusters = []
for i in range(num_clusters):
    data += [{'x': normalvariate(xmean[i], sigma), 'y':
              normalvariate(ymean[i], sigma), '_label': label[i]} for j in
             range(num_samples)]
    actual.append(Ellipse([xmean[i], ymean[i]], width=4*sigma,
                          height=4*sigma, angle=0))
shuffle(data)
trained = []

#plt.ion()

#plt.show()

tree = Cobweb3Tree()

# draw the actual sampling distribution
for c in actual:
    c.set_alpha(0.08)
    c.set_facecolor("blue")
    plt.gca().add_patch(c)

for datum in data:
    #train the tree on the sampled datum
    tree.ifit(datum)
    trained.append(datum)

    # remove old cluster circles
    for c in clusters:
        c.remove()

    # 4 * std gives two std on each side (~95% confidence)
    clusters = [Ellipse([cluster.av_counts['x'][cv].unbiased_mean(),
                         cluster.av_counts['y'][cv].unbiased_mean()],
                        width=4*cluster.av_counts['x'][cv].unbiased_std(),
                        height=4*cluster.av_counts['y'][cv].unbiased_std(),
                        angle=0) for cluster in tree.root.children]

    # draw the cluster circles
    for c in clusters:
        c.set_alpha(0.1)
        c.set_facecolor('red')
        plt.gca().add_patch(c)

    # draw the new point
    plt.plot([datum['x']], [datum['y']], datum['_label'])


    #plt.draw()
    #time.sleep(0.0001)

plt.axis([-10, 10, -15, 10])
red_patch = mpatches.Patch(color='red', alpha=0.1)
blue_patch = mpatches.Patch(color='blue', alpha=0.08)
samples_patch = mpatches.Patch(color='blue')
plt.legend([red_patch, blue_patch, samples_patch], ['COBWEB/3 Clusters',
                                                    'True Clusters',
                                                    'Sampled Points'], loc=3)

#plt.ioff()
plt.show()
(Source code, png, hires.png, pdf)